

This article has a slightly different character from my previous pieces.
Rather than looking at uranium as a long-term investment, I want to focus on a shorter-term question: could the sector offer an interesting trading opportunity over the next few weeks or months?
That matters because uranium equities can move 30% or more in a relatively short period. I have seen this many times over the last decade.
On April 17, I published an article covering the longer-term uranium thesis. The main points remain valid and if you are new to the sector I encourage to read it.

What has changed is the setup.
The uranium spot price has remained relatively stable, the long-term price has moved higher, while the Sprott Uranium Miners ETF (URNM), which I use as a proxy for uranium equities, has dropped by around 30% from mid-April to the end of July and by about 24% to the end of session on 6th of August.
Back in April, I was not particularly interested in buying uranium equities. Today, prices are much lower and we are entering what has historically been a stronger part of the year.
So the question is simple:
Could August 2026 offer an attractive entry point for a short-term uranium trade?
I see five factors worth watching.
1. Uranium seasonality and current entry point
For this analysis, I will use the Sprott Uranium Miners ETF (URNM) as a proxy for uranium equities. In my opinion, it is the best representation of the sector because it is focused purely on uranium companies and is reasonably diversified across the industry.
URNM was launched in December 2019, giving us six completed years of data. It is not a large sample, but almost all of it covers the current uranium bull market, which makes the comparison useful.
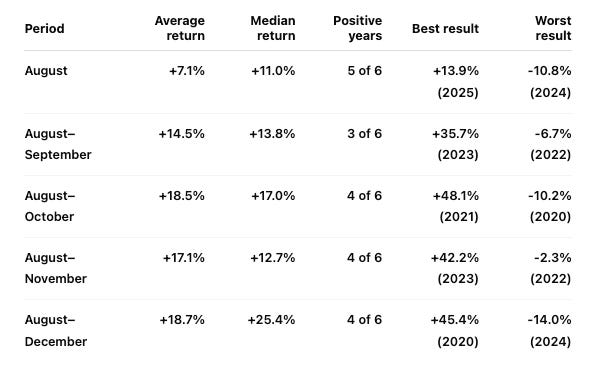
The table below shows what happened after entering URNM at the beginning of August.
Source: Resource Mind (Mateusz Włodarczyk), based on historical URNM price data from Stooq. Returns are calculated using closing prices from the last trading day of July and the last trading day of each respective period.
The results are interesting.
August itself was positive in five out of six completed years. Looking further out, returns from early August to October, November and December were also positive in four out of six years, with attractive average and median returns.
Of course, six years of data is far too little to treat seasonality as a rule. 2022 and 2024 also show that the trade can go wrong.
Still, historically, August has been an interesting entry point.
Now let’s look at the current technical setup.
Source: Yahoo finance, as of 6th August 2026
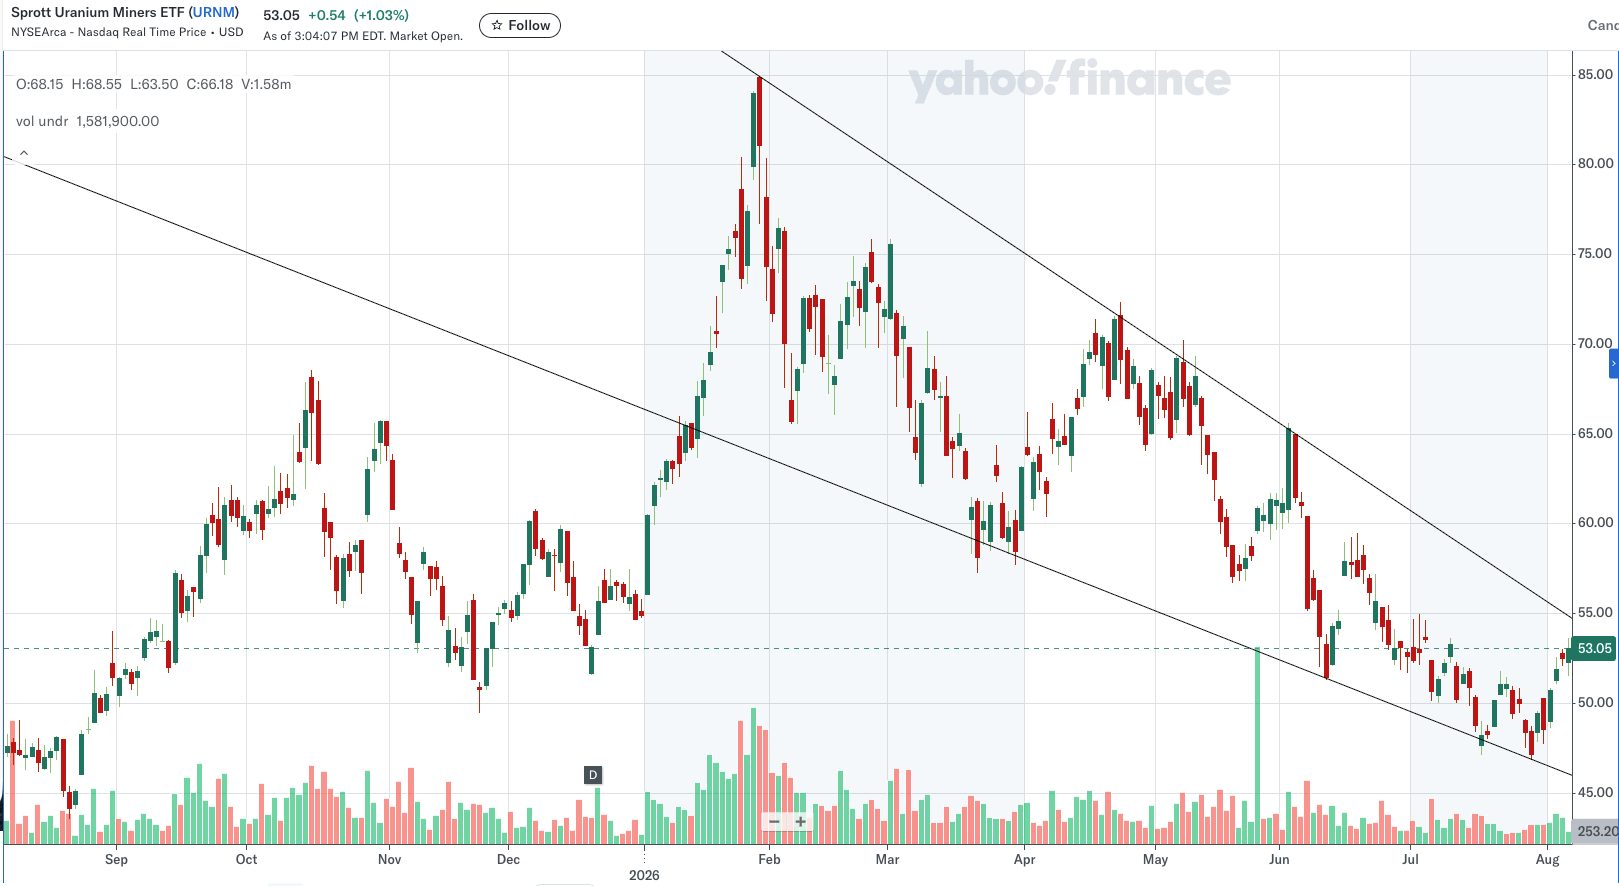
Uranium equities are still around 36% below their January highs, after being down as much as 45% by the end of July.
I purposely keep the chart simple. Uranium trends can change very quickly and I don’t think adding ten technical indicators would make the picture much clearer.
What interests me is that we are entering a historically stronger period after one of the weakest April-July performances since URNM was launched.
A breakout from the current downtrend could strengthen the short-term thesis further, as it may attract fresh capital into uranium ETFs. Given how small the sector is, significant inflows could move uranium equities higher very quickly.
That alone would not be enough for me.
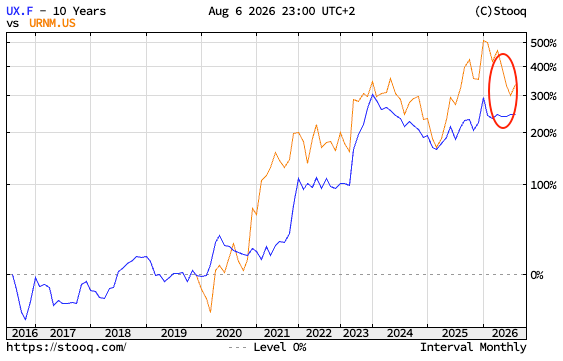
The next question is whether uranium equities fell because the underlying uranium market also weakened.
Source: data from Source: https://stooq.com as of the end of session on 5th of August, monthly interval
This is where things become more interesting.
URNM has fallen sharply while the uranium spot price remained relatively stable. At the same time, the long-term uranium price has moved higher.
The correlation between uranium equities and the uranium price has historically been very significant, which makes the current divergence worth watching.
It does not neccessarily need to mean that URNM has to rebound.
But with a much lower entry point, historically favourable seasonality and uranium equities lagging the performance of uranium price, I find this setup much more interesting than it was three months ago.
At this point, one could argue that this is already enough to make a decision. My approach is more complicated and require also understanding potential specific catalysts as well as associated risk. And the next points will guide this.
2. Supply continues to struggle
One of the reasons I still find the short-term setup interesting is that uranium supply has remained weaker than many expected at the beginning of the year.
Several restart stories have disappointed. Lotus Resources, Peninsula Energy and enCore Energy have all faced slower-than-expected ramp-ups, permitting delays or operational issues. Global Atomic’s DASA project in Niger is also moving slower than originally expected and still needs additional financing.
And the problems are not limited to smaller producers.
Kazatomprom entered 2026 with a lower production plan than previously expected, partly because of sulphuric acid constraints. Cameco has kept its 2026 production guidance so far, but first-half production was still 5% lower year over year and the company also faced temporary operational disruptions.
This matters because producers already have delivery commitments.
If production comes in below expectations, they can use inventories, renegotiate deliveries or buy uranium from the market.
Even the failed or delayed restarts alone could potentially mean a few million pounds that need to be sourced elsewhere.
On a larger scale, Cameco is a good example of how this can work. According to Cameco's Q2 2026 report, the company expects 19.5-21.5 million lbs of its own production in 2026, while planned deliveries are 29-32 million lbs. The gap will be covered through committed purchases, inventories, product loans and up to 3 million lbs of market purchases. Cameco also clearly states that market purchases could be higher if production is lower than planned.
There are also positive developments on the supply side. NexGen and Denison, both of which have large development projects received approvals for construction this year.
But for me, this matters much more for the longer-term uranium story than for the next few months.
Both projects are still years away from production and will still need to prove that the assumptions from their studies can be delivered in practice.
For a trade measured in weeks or months, I care much more about the pounds available today.
And this is where it gets interesting.
Some producers may need to come back to the market for additional material at the same time as utilities potentially become more active buyers later in the year.
3. Utilities may also become more active buyers by year end
Another reason why I believe the risk/reward has improved is utility contracting.
According to Yellow Cake, only just over 32.5 million lbs of utility-related long-term contracts were completed during the first half of 2026. Cameco reports a very similar figure of around 33 million lbs.
For perspective, annual reactor requirements are roughly 200 million lbs.
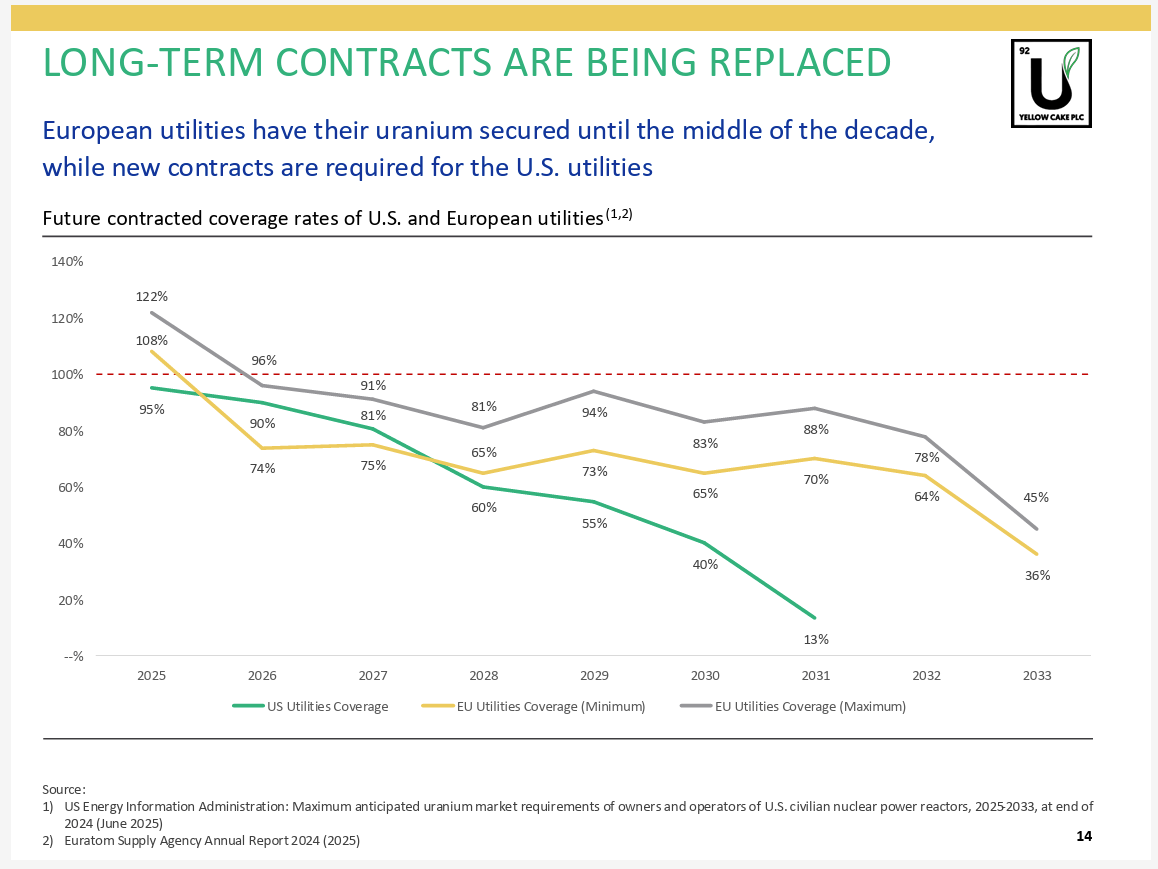
Looking further ahead, US utilities are also becoming increasingly undercovered later this decade, as shown in the Yellow Cake chart below.
Source: Yellowcake Plc presentation, July 2026
What I find interesting is that, despite relatively low contracting activity, the long-term uranium price increased from around $86/lb at the end of 2025 to roughly $94–95 per lbs by the end of June. Buyers are already accepting higher prices to secure future supply.
Yellow Cake also notes that, after securing conversion and enrichment capacity, utilities are increasingly shifting their attention back to natural uranium and expects term contracting to increase during the second half of the year. Cameco is also seeing utility RFPs and more interest in direct long-term negotiations.
The World Nuclear Symposium in London in September is another event I will be watching closely. It is one of the main meeting points for the industry and often coincides with a more active contracting period later in the year.
If utilities return to the market more aggressively in Q4, it could support both long-term and spot uranium prices, as well as sentiment towards the sector.
4. ETF flows may be starting to turn
For uranium equities, ETF flows matter a lot.
The sector is small, so when money flows into funds such as URNM and, more importantly, URA (about 3 times bigger than URNM), those funds need to buy the underlying uranium stocks. When the inflows are large enough, this can move the whole sector surprisingly quickly.
The opposite also works.
Strong outflows from URA ETF over the last few months went together with the correction in uranium equities. URNM was more balanced and the inflows are visible.
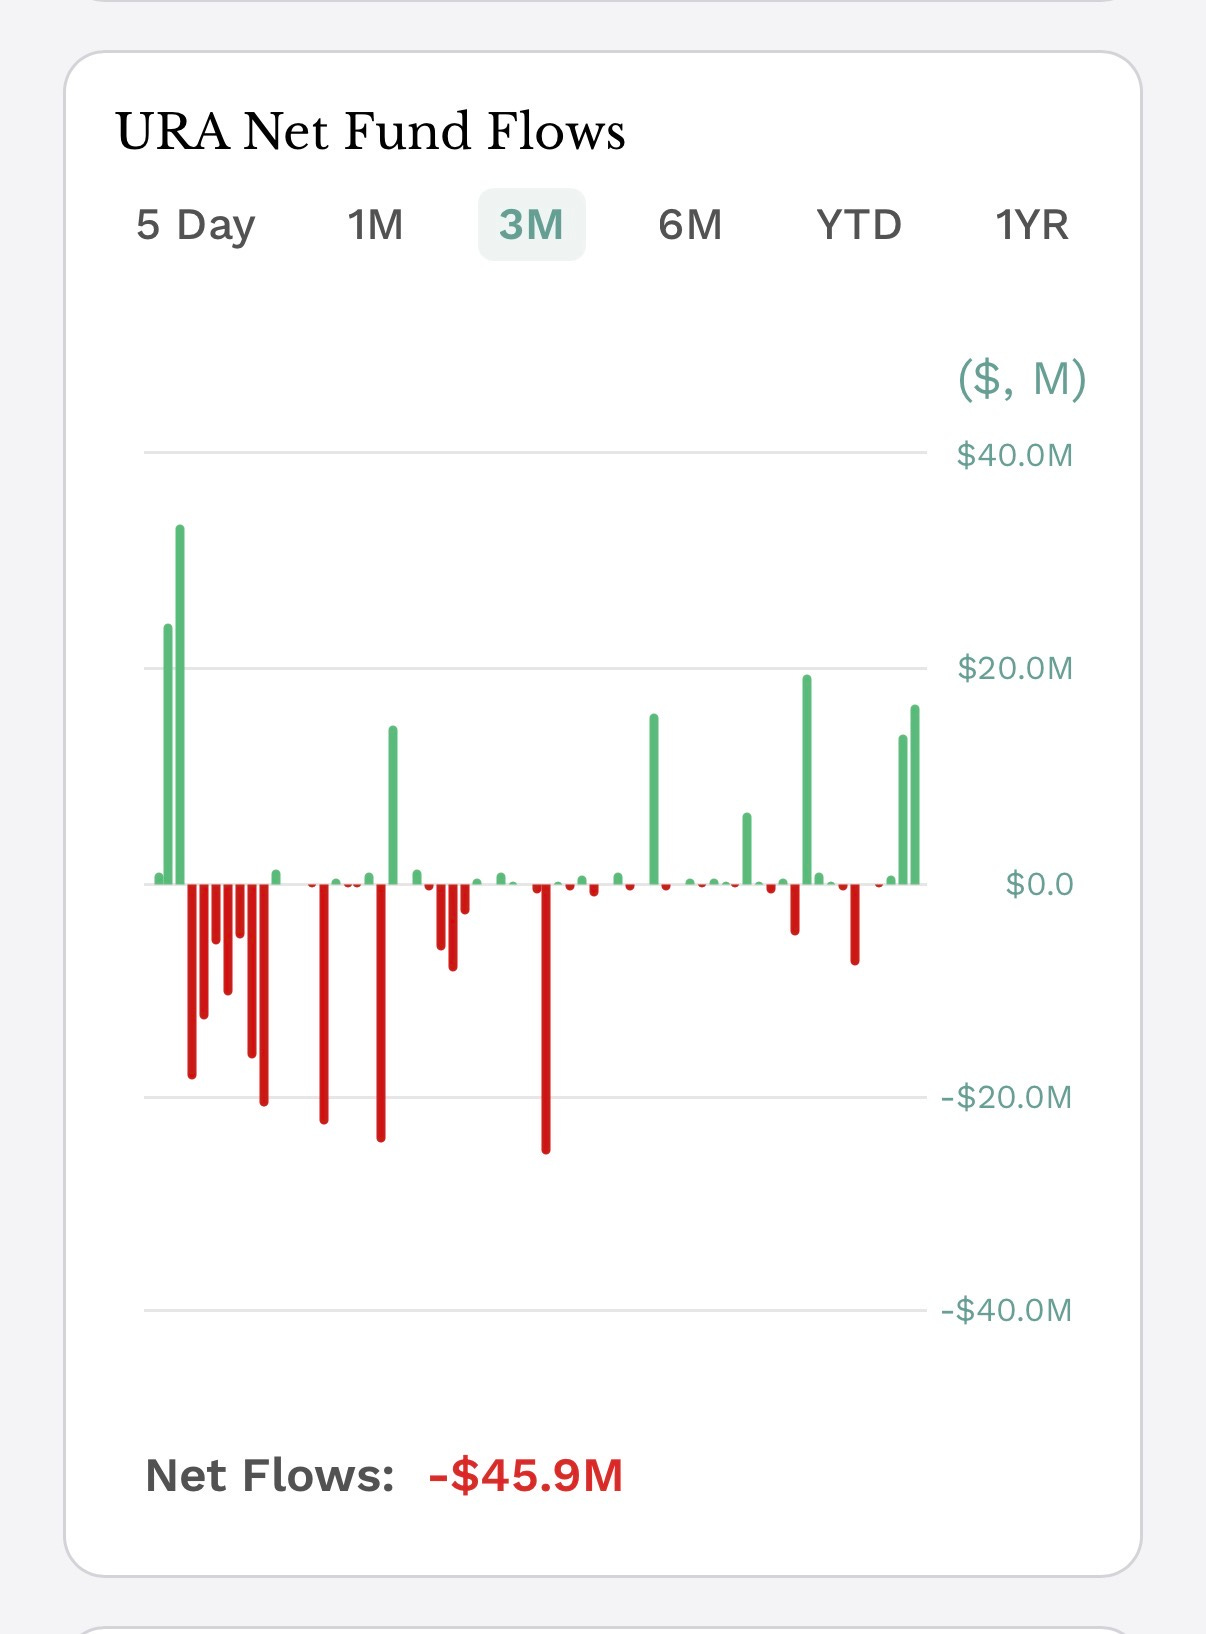
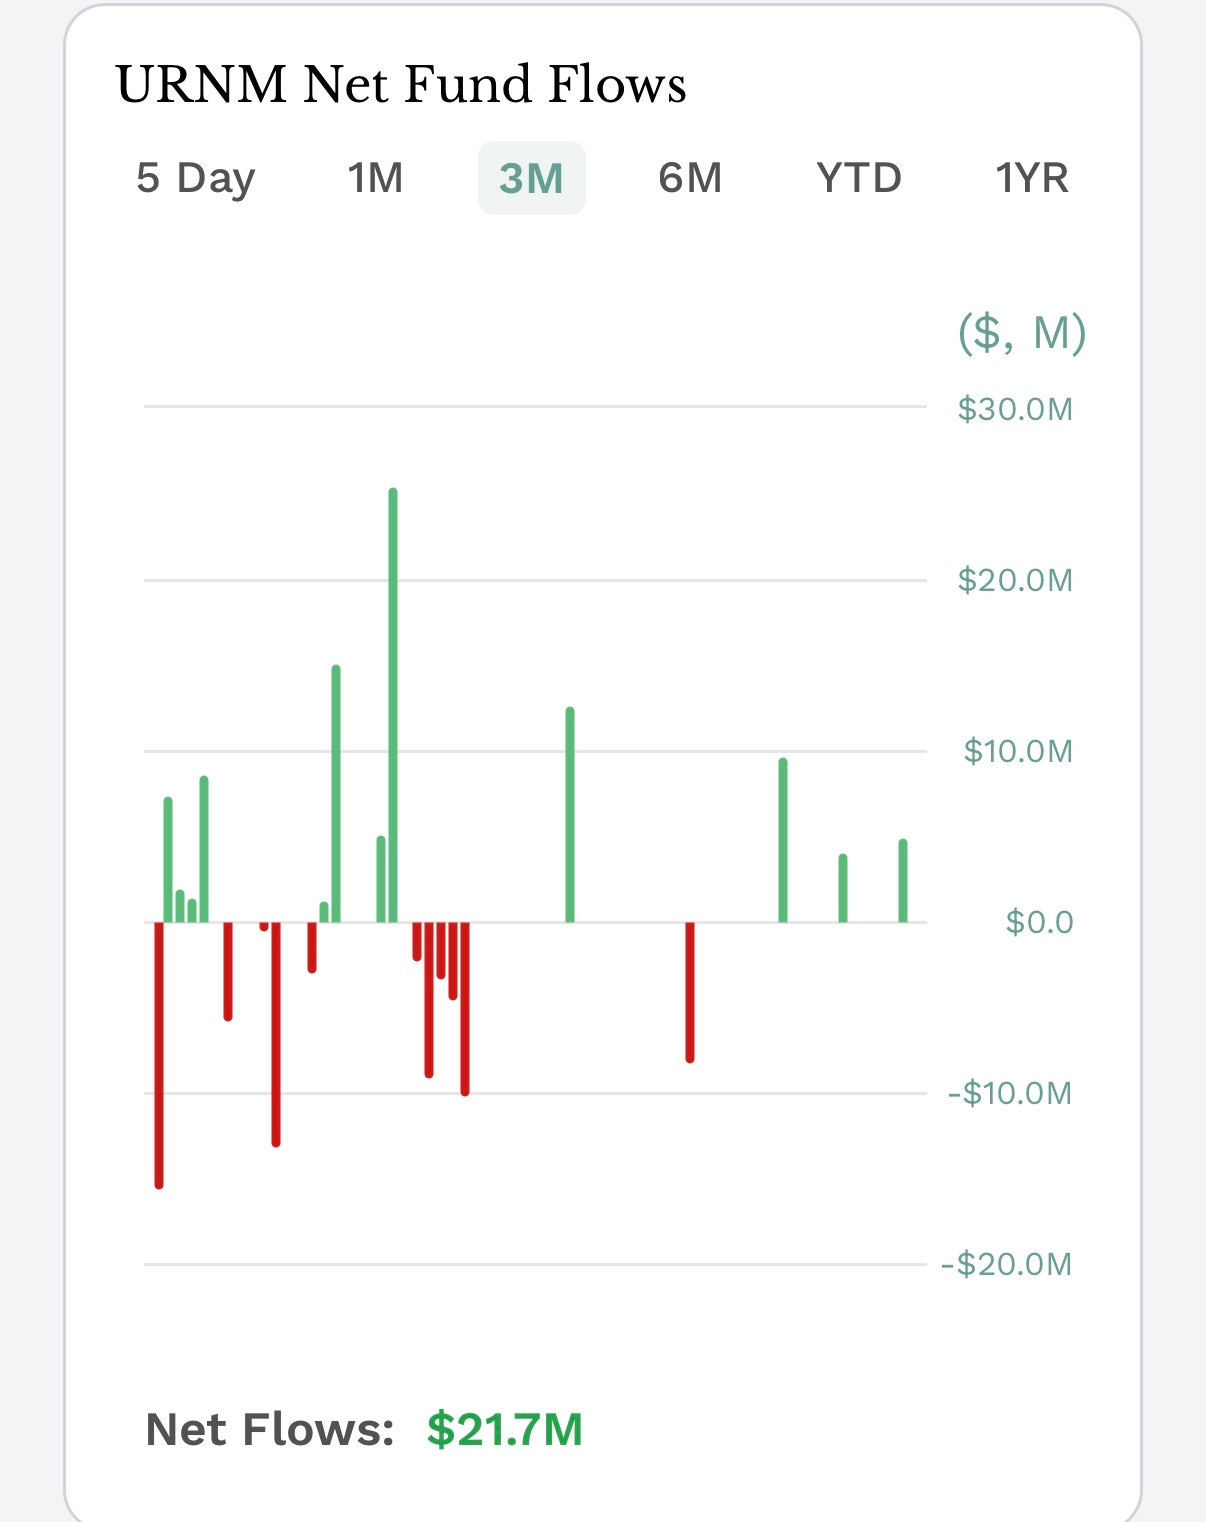
Source for both charts: ETF.com
Over the last few weeks, flows into the two main uranium miners ETFs have improved and both are now seeing inflows.
It is still too early to call this a clear trend reversal, but if the inflows continue, they could become an important tailwind for uranium equities.
5. Key risks
If this is a trade rather than a long-term investment, the risks matter even more.
There are many things that could go wrong, but two risks could change the setup very quickly.
The first is a broader equity market sell-off.
The S&P 500 has been much stronger in 2026 than many investors expected, which has supported liquidity and risk appetite. But if the broader market starts falling sharply, I would expect uranium equities to fall much more than the index.
The chart below compares the S&P 500 (blue line) with URNM (gold line) over the last three years. The pattern is quite clear — corrections in uranium equities have generally been much deeper.
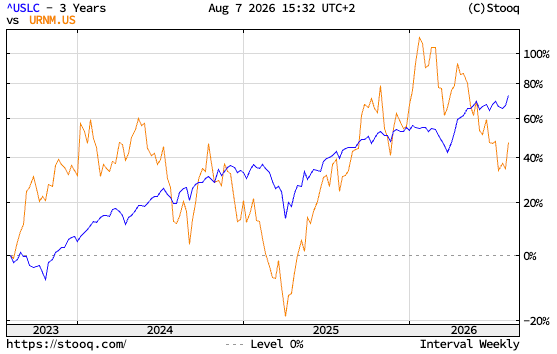
Source: https://stooq.com
The second is the risk of a serious incident involving a nuclear power plant or the nuclear fuel cycle.
I think that with ongoing geopolitical tensions and conflicts close to nuclear facilities, this is a risk that cannot be ignored. Any major incident could damage sentiment towards uranium almost immediately.
History shows how quickly sentiment can change. Both Chernobyl and Fukushima had a major impact on the nuclear industry, and Fukushima in particular contributed to a long period of weak uranium demand and sentiment after 2011.
There are other risks, but most of them would probably take longer to play out.
These two could invalidate the short-term thesis very quickly.
6. Conclusion
This is a trading idea measured in weeks or months, not a prediction of what uranium will do over the next decade.
The setup looks interesting to me today because several things are coming together:
URNM is already after a sharp correction.
August and the following months have historically offered attractive asymmetry.
Supply challenges remain visible and some producers may need to source additional pounds from the market.
Utility contracting is still relatively limited, while long-term uranium prices remain strong.
ETF outflows appear to be fading and some inflows are already visible.
None of these factors guarantees that uranium equities will go higher or that the worst of 2026 is already behind us.
So would I enter today?
After roughly an 8% move in URNM since the beginning of August, I would personally feel more comfortable initiating a position on a pullback, on a clear break of the current downtrend, or if we start seeing a more significant acceleration in ETF inflows.
The examples of 2022 and 2024 also show that a strong move after August does not guarantee a strong finish to the year.
Still, many pieces of the puzzle are now in place at a time of the year that has historically been constructive for uranium equities.
For me, that makes the sector worth watching closely for a potential short-term rebound.
As always, I am not trying to predict what the market will do. I simply look for situations where, in my opinion, the potential reward appears greater than the risk.
Disclaimer
I own uranium-related investments. The views expressed in this article are my personal opinions and should not be considered investment advice.